
- Start >
- Meteorology >
- Air moisture >
- Naab - Regen >
- Pösing >
- Chart of total period

Chart of total period Pösing
Air moisture from 22.05.2007 to 10.05.2024
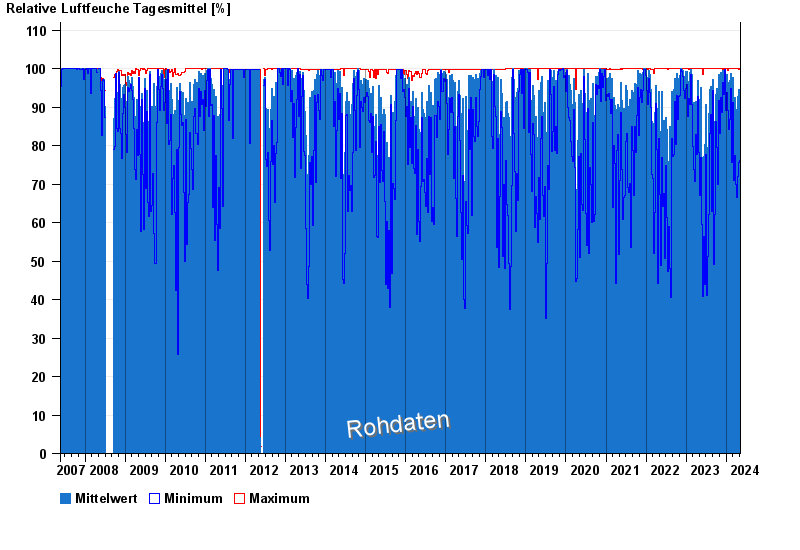
Note: The time series in the selected period has gaps.
| Date | Mean value [%] | Maximum [%] | Minimum [%] |
|---|---|---|---|
| 10.05.2024 | 98.3 | 99.9 | 86.1 |
| 09.05.2024 | 69.2 | 99.9 | 39.9 |
| 08.05.2024 | 82.7 | 91.6 | 66.8 |
| 07.05.2024 | 91.3 | 100.0 | 80.0 |
| 06.05.2024 | 80.4 | 100.0 | 49.6 |
| 05.05.2024 | 87.3 | 100.0 | 59.0 |
| 04.05.2024 | 77.5 | 99.3 | 50.3 |
© Bayerisches Landesamt für Umwelt 2024