
- Start >
- Meteorology >
- Air moisture >
- Obere Donau >
- Neuhof >
- Chart of total period

Chart of total period Neuhof
Air moisture from 22.07.1993 to 26.04.2024
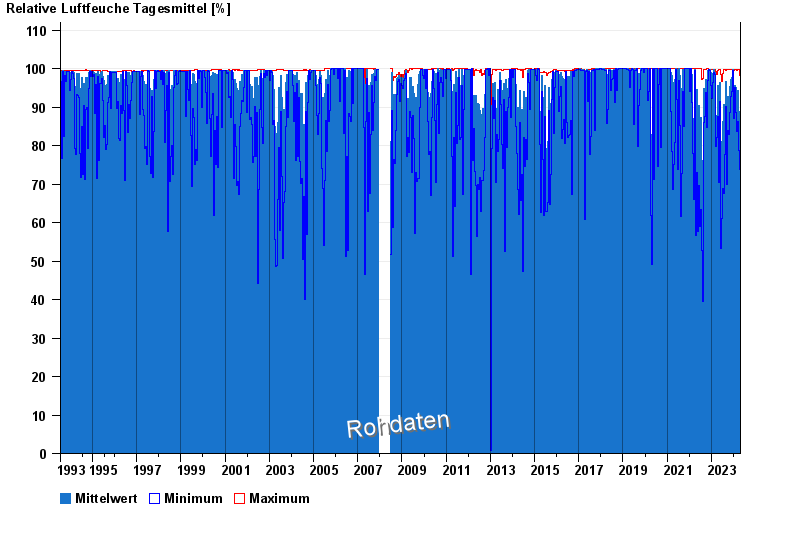
Note: The time series in the selected period has gaps.
| Date | Mean value [%] | Maximum [%] | Minimum [%] |
|---|---|---|---|
| 26.04.2024 | 76.9 | 93.3 | 48.9 |
| 25.04.2024 | 82.2 | 96.0 | 57.6 |
| 24.04.2024 | 78.3 | 95.4 | 50.3 |
| 23.04.2024 | 74.9 | 90.4 | 62.2 |
| 22.04.2024 | 72.8 | 97.1 | 46.7 |
| 21.04.2024 | 89.8 | 97.7 | 68.1 |
| 20.04.2024 | 78.4 | 94.3 | 54.1 |
© Bayerisches Landesamt für Umwelt 2024