
- Start >
- Meteorology >
- Air moisture >
- Obere Donau >
- Gablingen >
- Chart of total period

Chart of total period Gablingen
Air moisture from 29.06.1994 to 13.06.2014
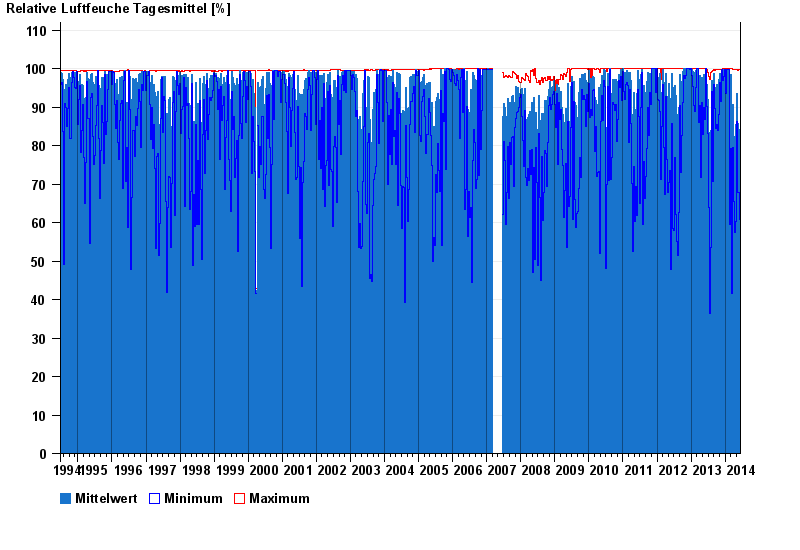
Note: The time series in the selected period has gaps.
note
Station aufgelassen am 13.06.2014 !
| Date | Mean value [%] | Maximum [%] | Minimum [%] |
|---|---|---|---|
| 13.06.2014 | 78.0 | 87.9 | 65.8 |
| 12.06.2014 | 66.4 | 96.8 | 40.9 |
| 11.06.2014 | 60.6 | 86.9 | 37.8 |
| 10.06.2014 | 51.9 | 91.5 | 23.7 |
| 09.06.2014 | 55.2 | 91.4 | 19.2 |
| 08.06.2014 | 55.2 | 95.7 | 20.3 |
| 07.06.2014 | 58.0 | 96.7 | 24.7 |
© Bayerisches Landesamt für Umwelt 2026