
- Start >
- Meteorology >
- Air moisture >
- Obere Donau >
- Burgheim >
- Chart of total period

Chart of total period Burgheim
Air moisture from 25.06.1993 to 26.04.2024
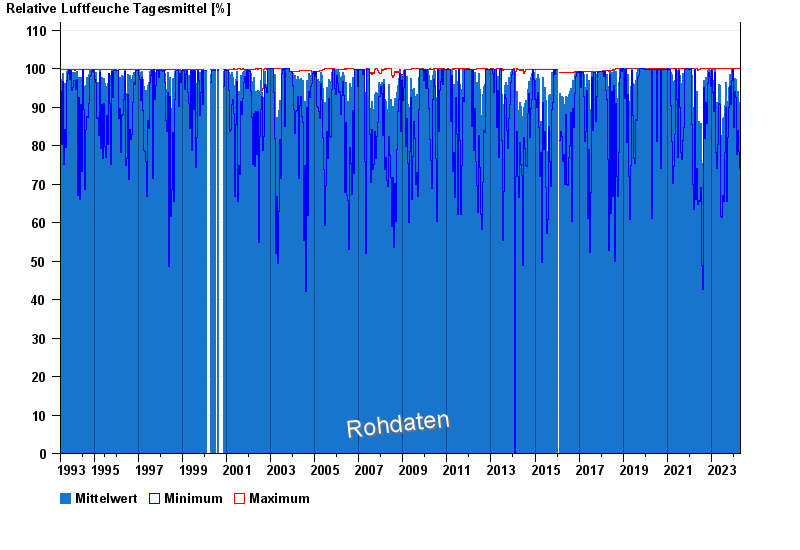
Note: The time series in the selected period has gaps.
| Date | Mean value [%] | Maximum [%] | Minimum [%] |
|---|---|---|---|
| 26.04.2024 | 99.8 | 99.9 | 99.5 |
| 25.04.2024 | 84.0 | 99.4 | 63.0 |
| 24.04.2024 | 80.3 | 96.0 | 51.0 |
| 23.04.2024 | 78.3 | 90.5 | 68.0 |
| 22.04.2024 | 74.9 | 96.2 | 53.4 |
| 21.04.2024 | 87.1 | 95.2 | 67.3 |
| 20.04.2024 | 78.3 | 92.3 | 57.9 |
© Bayerisches Landesamt für Umwelt 2024