
- Start >
- Meteorology >
- Air moisture >
- Isar >
- Westerschondorf >
- Chart of total period

Chart of total period Westerschondorf
Air moisture from 26.06.1993 to 08.08.2017
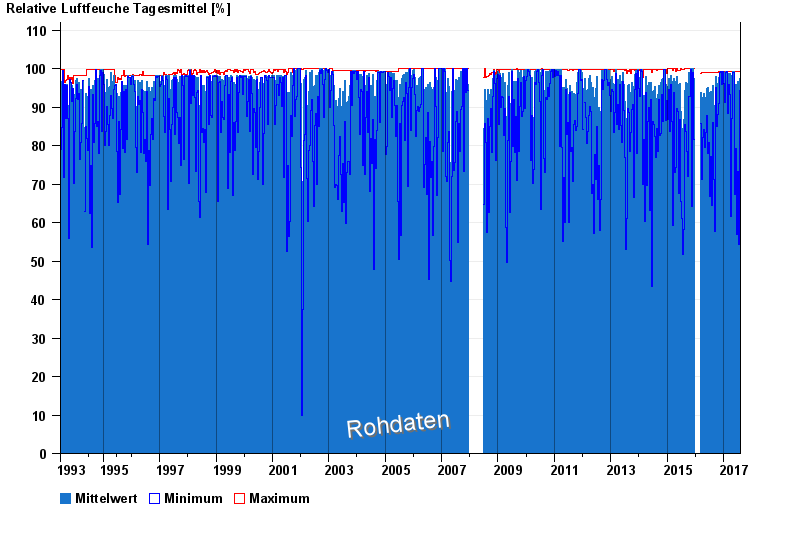
Note: The time series in the selected period has gaps.
note
z.Z. defekt
| Date | Mean value [%] | Maximum [%] | Minimum [%] |
|---|---|---|---|
| 08.08.2017 | 95.2 | 98.7 | 84.2 |
| 07.08.2017 | 76.4 | 99.0 | 52.2 |
| 06.08.2017 | 78.1 | 98.3 | 64.5 |
| 05.08.2017 | 66.3 | 93.0 | 48.9 |
| 04.08.2017 | 73.9 | 95.9 | 58.3 |
| 03.08.2017 | 69.2 | 93.3 | 40.8 |
| 02.08.2017 | 77.4 | 98.5 | 46.0 |
© Bayerisches Landesamt für Umwelt 2026