
- Start >
- Meteorology >
- Air moisture >
- Isar >
- Viehhausen >
- Chart of total period

Chart of total period Viehhausen
Air moisture from 23.05.2007 to 26.04.2024
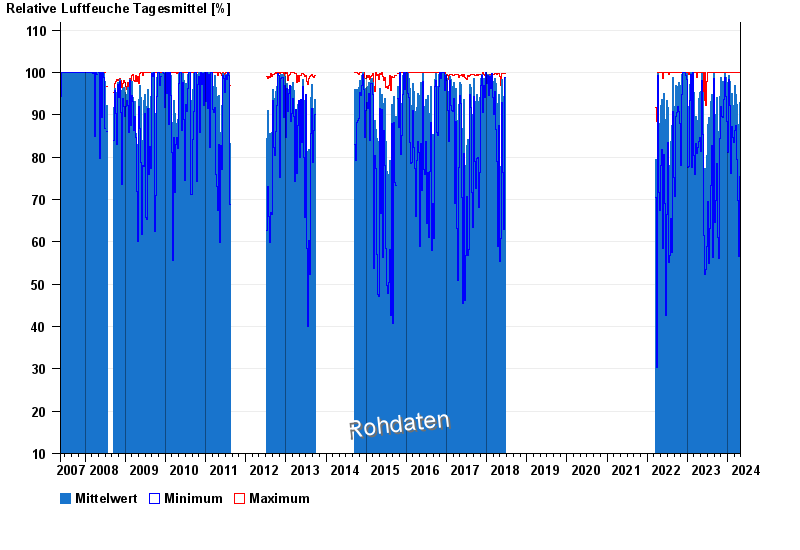
Note: The time series in the selected period has gaps.
| Date | Mean value [%] | Maximum [%] | Minimum [%] |
|---|---|---|---|
| 26.04.2024 | 65.9 | 99.0 | 32.7 |
| 25.04.2024 | 76.9 | 94.8 | 50.3 |
| 24.04.2024 | 76.8 | 93.4 | 48.6 |
| 23.04.2024 | 82.2 | 90.8 | 68.7 |
| 22.04.2024 | 75.6 | 97.1 | 53.7 |
| 21.04.2024 | 91.8 | 98.7 | 75.2 |
| 20.04.2024 | 86.3 | 97.4 | 73.5 |
© Bayerisches Landesamt für Umwelt 2024