
- Start >
- Meteorology >
- Air moisture >
- Isar >
- Spitzingsee Freiland 1 >
- Chart of total period

Chart of total period Spitzingsee Freiland 1
Air moisture from 08.04.2005 to 27.04.2024
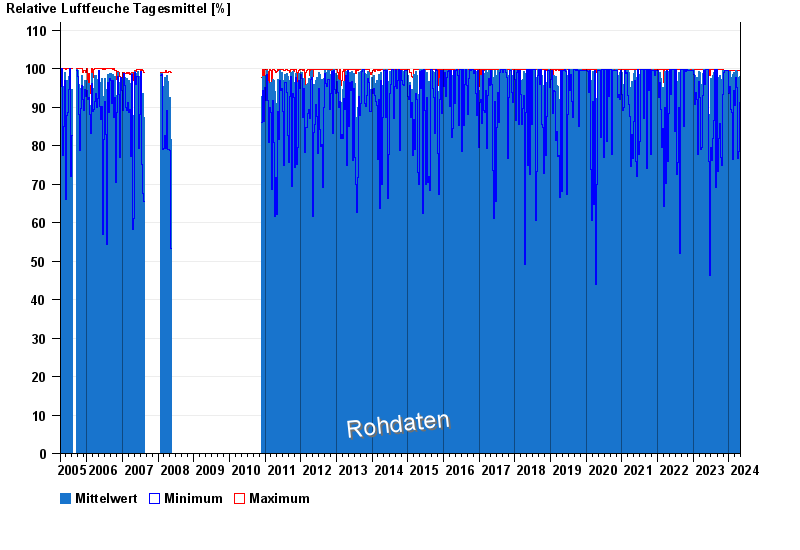
Note: The time series in the selected period has gaps.
| Date | Mean value [%] | Maximum [%] | Minimum [%] |
|---|---|---|---|
| 27.04.2024 | 72.6 | 84.0 | 43.0 |
| 26.04.2024 | 81.9 | 95.6 | 55.2 |
| 25.04.2024 | 84.5 | 98.5 | 51.8 |
| 24.04.2024 | 89.2 | 99.5 | 61.3 |
| 23.04.2024 | 99.0 | 99.5 | 94.4 |
| 22.04.2024 | 98.0 | 99.5 | 91.1 |
| 21.04.2024 | 94.1 | 99.5 | 70.0 |
© Bayerisches Landesamt für Umwelt 2024