
- Start >
- Meteorology >
- Air moisture >
- Isar >
- Mittelstetten >
- Chart of total period

Chart of total period Mittelstetten
Air moisture from 18.07.1994 to 10.04.2013
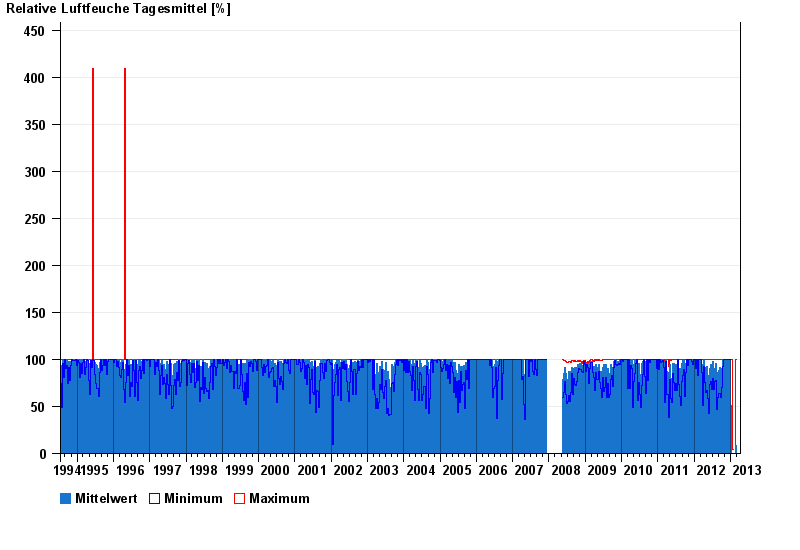
Note: The time series in the selected period has gaps.
note
z.Z. defekt
| Date | Mean value [%] | Maximum [%] | Minimum [%] |
|---|---|---|---|
| 10.04.2013 | 0.5 | 0.5 | 0.5 |
| 09.04.2013 | 0.5 | 0.5 | 0.5 |
| 08.04.2013 | 0.5 | 0.5 | 0.5 |
| 07.04.2013 | 0.5 | 0.5 | 0.5 |
| 06.04.2013 | 0.5 | 0.5 | 0.5 |
| 05.04.2013 | 0.5 | 0.5 | 0.5 |
| 04.04.2013 | 0.5 | 0.5 | 0.5 |
© Bayerisches Landesamt für Umwelt 2026