
- Start >
- Meteorology >
- Air moisture >
- Isar >
- Laber >
- Chart of total period

Chart of total period Laber
Air moisture from 11.04.2005 to 11.10.2010
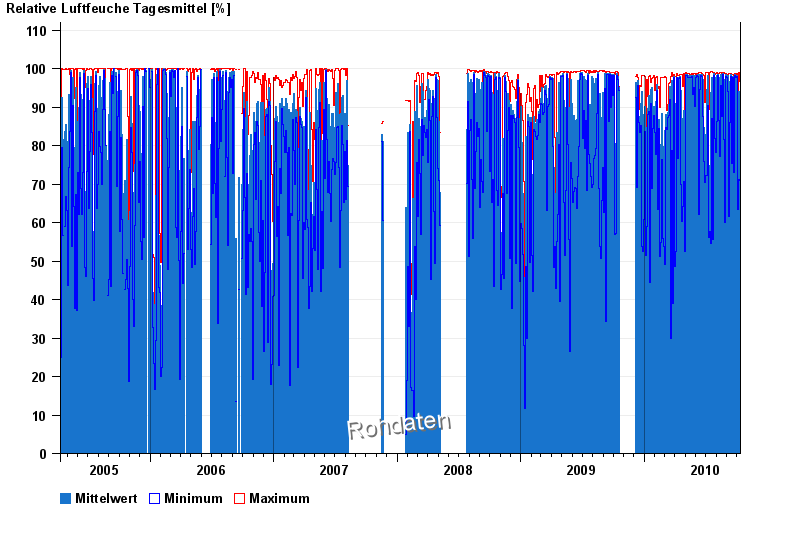
Note: The time series in the selected period has gaps.
| Date | Mean value [%] | Maximum [%] | Minimum [%] |
|---|---|---|---|
| 11.10.2010 | 65.9 | 75.8 | 52.7 |
| 10.10.2010 | 77.7 | 96.6 | 71.0 |
| 09.10.2010 | 77.3 | 95.9 | 63.2 |
| 08.10.2010 | 63.3 | 76.6 | 51.1 |
| 07.10.2010 | 85.7 | 98.2 | 63.6 |
| 06.10.2010 | 93.9 | 98.7 | 71.3 |
| 05.10.2010 | 93.9 | 98.9 | 70.5 |
© Bayerisches Landesamt für Umwelt 2026