
- Start >
- Meteorology >
- Air moisture >
- Isar >
- Karolinenfeld >
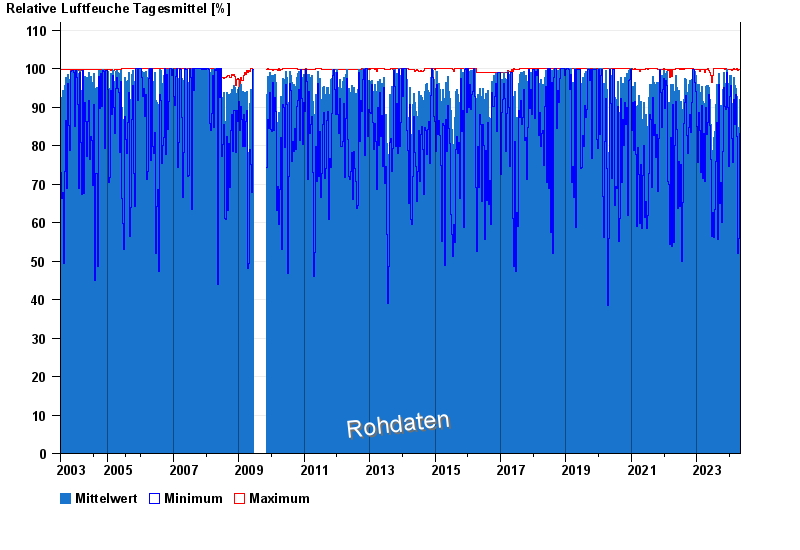
- Chart of total period

Chart of total period Karolinenfeld
Air moisture from 21.07.2003 to 02.05.2024
Note: The time series in the selected period has gaps.
| Date | Mean value [%] | Maximum [%] | Minimum [%] |
|---|---|---|---|
| 02.05.2024 | 51.2 | 81.7 | 29.2 |
| 01.05.2024 | 47.7 | 84.0 | 32.3 |
| 30.04.2024 | 50.4 | 90.4 | 25.8 |
| 29.04.2024 | 69.4 | 99.5 | 39.4 |
| 28.04.2024 | 44.2 | 80.1 | 29.0 |
| 27.04.2024 | 54.8 | 96.9 | 25.5 |
| 26.04.2024 | 62.7 | 99.4 | 29.9 |
© Bayerisches Landesamt für Umwelt 2024