
- Start >
- Meteorology >
- Air moisture >
- Isar >
- Bürg >
- Chart of total period

Chart of total period Bürg
Air moisture from 30.09.1994 to 29.04.2024
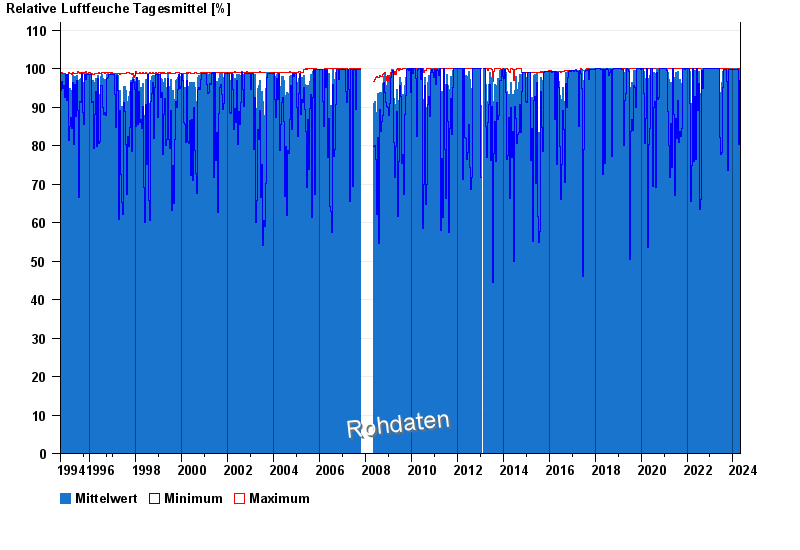
Note: The time series in the selected period has gaps.
| Date | Mean value [%] | Maximum [%] | Minimum [%] |
|---|---|---|---|
| 29.04.2024 | 79.6 | 100.0 | 50.3 |
| 28.04.2024 | 68.4 | 96.8 | 40.8 |
| 27.04.2024 | 68.1 | 100.0 | 37.7 |
| 26.04.2024 | 74.7 | 100.0 | 37.5 |
| 25.04.2024 | 90.1 | 100.0 | 62.7 |
| 24.04.2024 | 92.9 | 100.0 | 62.8 |
| 23.04.2024 | 98.4 | 100.0 | 88.7 |
© Bayerisches Landesamt für Umwelt 2024