
- Start >
- Meteorology >
- Air moisture >
- Isar >
- Brecherspitze >
- Chart of total period

Chart of total period Brecherspitze
Air moisture from 11.04.2005 to 12.04.2018
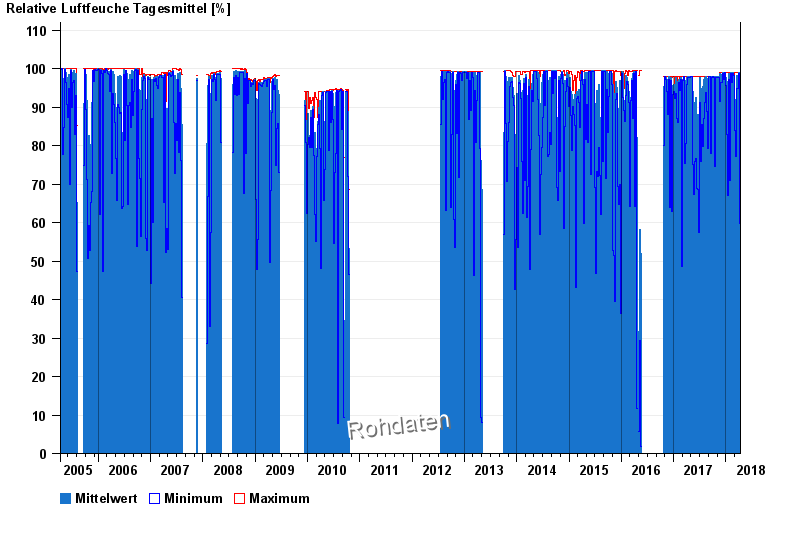
Note: The time series in the selected period has gaps.
| Date | Mean value [%] | Maximum [%] | Minimum [%] |
|---|---|---|---|
| 12.04.2018 | 58.7 | 66.3 | 45.1 |
| 11.04.2018 | 58.4 | 99.0 | 32.2 |
| 10.04.2018 | 52.9 | 78.4 | 33.8 |
| 09.04.2018 | 35.8 | 58.1 | 22.0 |
| 08.04.2018 | 38.3 | 49.5 | 28.3 |
| 07.04.2018 | 36.3 | 48.7 | 19.7 |
| 06.04.2018 | 70.9 | 99.0 | 38.9 |
© Bayerisches Landesamt für Umwelt 2026