
- Start >
- Meteorology >
- Air moisture >
- Inn >
- Frankenhofen >
- Chart of total period

Chart of total period Frankenhofen
Air moisture from 19.07.1994 to 16.01.2026
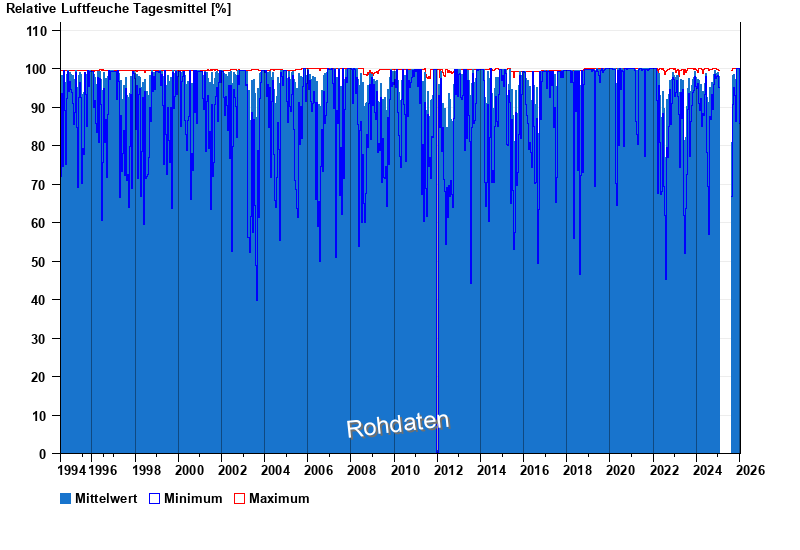
Note: The time series in the selected period has gaps.
| Date | Mean value [%] | Maximum [%] | Minimum [%] |
|---|---|---|---|
| 16.01.2026 | 82.2 | 84.0 | 81.2 |
| 15.01.2026 | 87.8 | 96.5 | 75.9 |
| 14.01.2026 | 86.1 | 92.7 | 78.0 |
| 13.01.2026 | 91.1 | 99.7 | 86.2 |
| 12.01.2026 | 96.6 | 100.0 | 92.4 |
| 11.01.2026 | 91.5 | 97.1 | 79.5 |
| 10.01.2026 | 97.1 | 100.0 | 90.8 |
© Bayerisches Landesamt für Umwelt 2026