
- Start >
- Meteorology >
- Air moisture >
- Iller - Lech - Bodensee >
- Schönau >
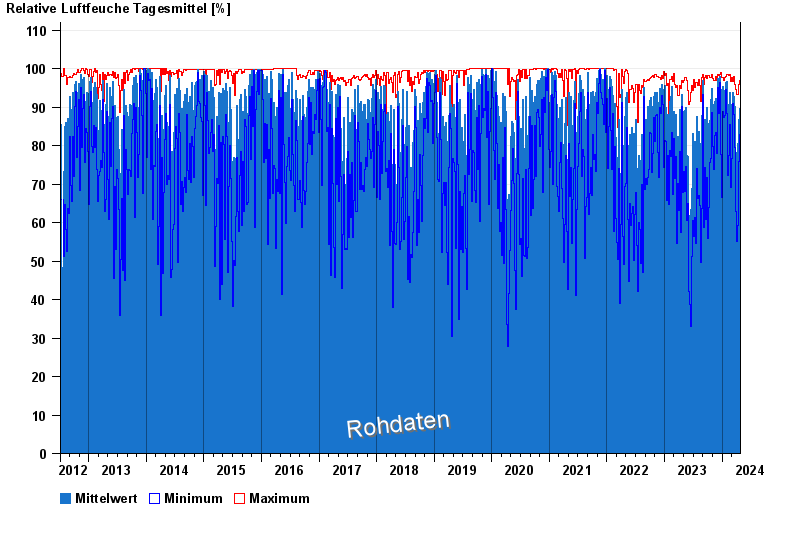
- Chart of total period

Chart of total period Schönau
Air moisture from 05.07.2012 to 26.04.2024
| Date | Mean value [%] | Maximum [%] | Minimum [%] |
|---|---|---|---|
| 26.04.2024 | 63.2 | 86.0 | 38.5 |
| 25.04.2024 | 67.6 | 87.6 | 43.0 |
| 24.04.2024 | 78.8 | 93.2 | 60.0 |
| 23.04.2024 | 77.9 | 89.8 | 69.2 |
| 22.04.2024 | 81.2 | 96.8 | 68.0 |
| 21.04.2024 | 89.7 | 96.1 | 82.8 |
| 20.04.2024 | 84.0 | 95.4 | 68.0 |
© Bayerisches Landesamt für Umwelt 2024