
- Start >
- Meteorology >
- Air moisture >
- Iller - Lech - Bodensee >
- Lautrach >
- Chart of total period

Chart of total period Lautrach
Air moisture from 01.10.1994 to 01.05.2024
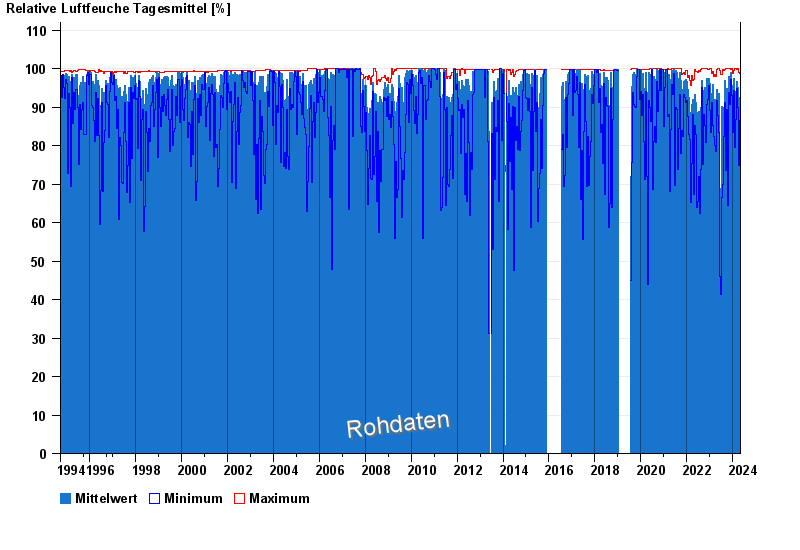
Note: The time series in the selected period has gaps.
| Date | Mean value [%] | Maximum [%] | Minimum [%] |
|---|---|---|---|
| 01.05.2024 | 76.7 | 88.0 | 52.2 |
| 30.04.2024 | 57.3 | 93.4 | 21.8 |
| 29.04.2024 | 68.3 | 96.2 | 41.4 |
| 28.04.2024 | 65.5 | 86.3 | 35.0 |
| 27.04.2024 | 61.7 | 97.2 | 26.6 |
| 26.04.2024 | 70.0 | 95.3 | 36.6 |
| 25.04.2024 | 78.7 | 95.4 | 47.5 |
© Bayerisches Landesamt für Umwelt 2024