
- Start >
- Meteorology >
- Air moisture >
- Iller - Lech - Bodensee >
- Frauenriedh >
- Chart of total period

Chart of total period Frauenriedh
Air moisture from 04.08.1994 to 24.01.2026
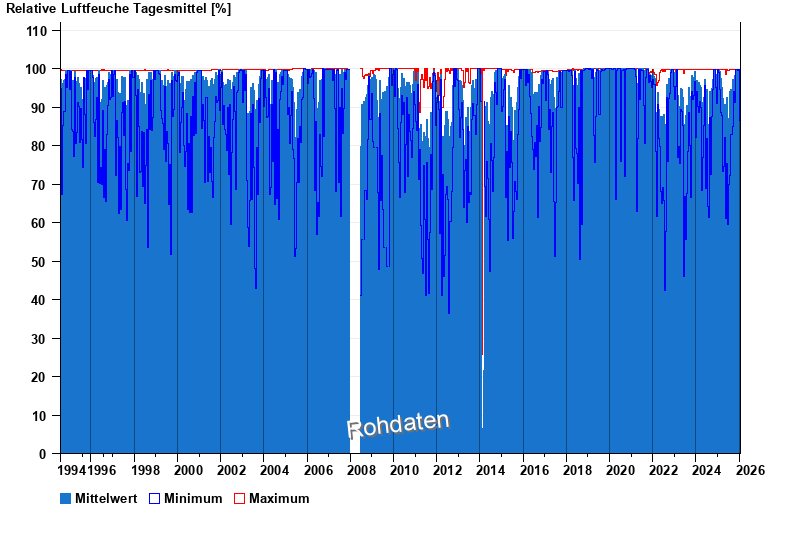
Note: The time series in the selected period has gaps.
| Date | Mean value [%] | Maximum [%] | Minimum [%] |
|---|---|---|---|
| 24.01.2026 | 97.2 | 99.8 | 93.3 |
| 23.01.2026 | 95.7 | 98.3 | 92.2 |
| 22.01.2026 | 93.5 | 96.3 | 86.4 |
| 21.01.2026 | 93.1 | 97.9 | 83.8 |
| 20.01.2026 | 98.7 | 99.7 | 97.4 |
| 19.01.2026 | 99.8 | 99.8 | 99.2 |
| 18.01.2026 | 99.5 | 99.8 | 98.2 |
© Bayerisches Landesamt für Umwelt 2026