
- Start >
- Meteorology >
- Air moisture >
- Iller - Lech - Bodensee >
- Fahrenberg >
- Chart of year

Chart of year Fahrenberg
Air moisture from 01.01.2023 to 31.12.2023
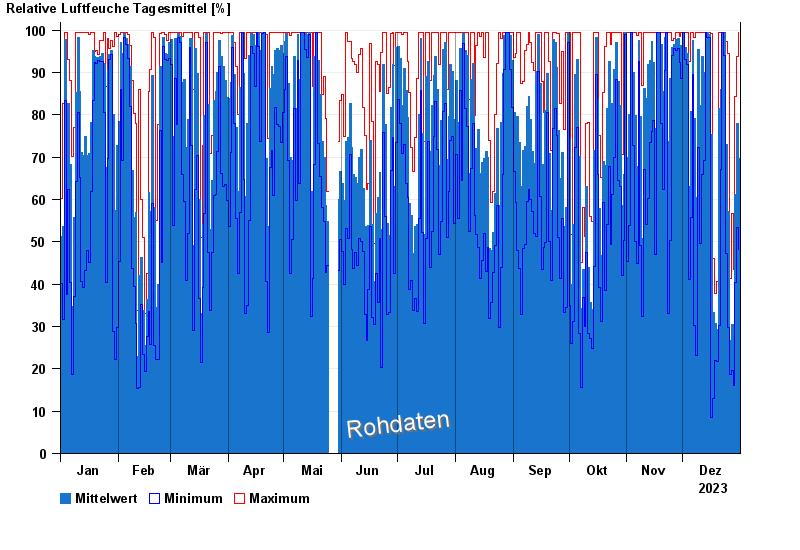
Note: The time series in the selected period has gaps.
| Date | Mean value [%] | Maximum [%] | Minimum [%] |
|---|---|---|---|
| 31.12.2023 | 69.7 | 99.4 | 48.2 |
| 30.12.2023 | 78.0 | 93.8 | 53.4 |
| 29.12.2023 | 61.2 | 84.3 | 40.3 |
| 28.12.2023 | 28.5 | 43.4 | 16.1 |
| 27.12.2023 | 30.5 | 56.6 | 19.6 |
| 26.12.2023 | 26.8 | 41.3 | 18.6 |
| 25.12.2023 | 57.2 | 94.5 | 29.8 |
© Bayerisches Landesamt für Umwelt 2024