
- Start >
- Meteorology >
- Air moisture >
- Iller - Lech - Bodensee >
- Fahrenberg >
- Chart of total period

Chart of total period Fahrenberg
Air moisture from 13.09.2019 to 26.04.2024
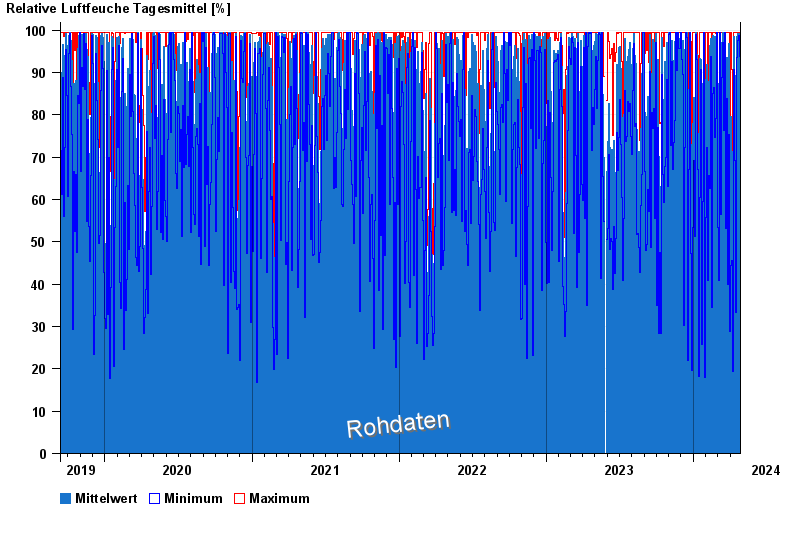
Note: The time series in the selected period has gaps.
| Date | Mean value [%] | Maximum [%] | Minimum [%] |
|---|---|---|---|
| 26.04.2024 | 71.9 | 90.5 | 47.9 |
| 25.04.2024 | 94.6 | 99.4 | 85.7 |
| 24.04.2024 | 98.7 | 99.4 | 93.9 |
| 23.04.2024 | 99.2 | 99.4 | 98.4 |
| 22.04.2024 | 99.3 | 99.4 | 98.8 |
| 21.04.2024 | 99.3 | 99.4 | 98.7 |
| 20.04.2024 | 99.3 | 99.4 | 97.5 |
© Bayerisches Landesamt für Umwelt 2024