
- Start >
- Meteorology >
- Air moisture >
- Bayern >
- Jenner >
- Chart of total period

Chart of total period Jenner
Air moisture from 31.05.2005 to 19.11.2021
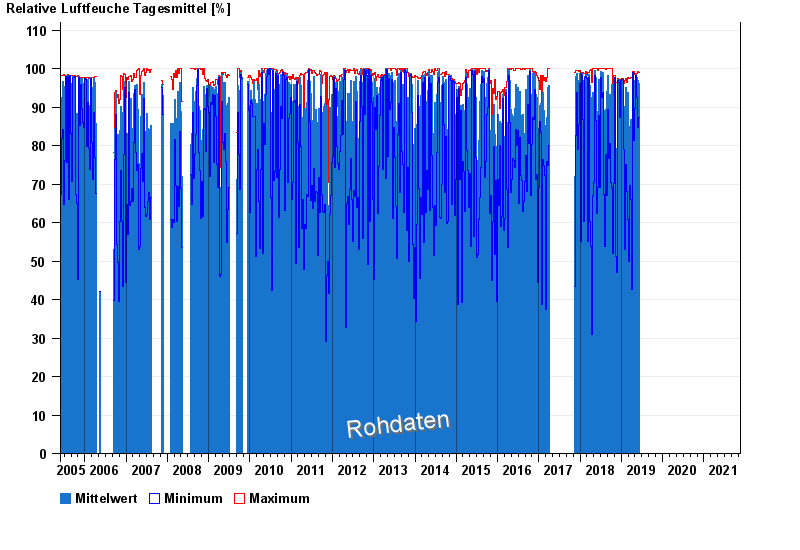
Note: The time series in the selected period has gaps.
note
z.Z. defekt
| Date | Mean value [%] | Maximum [%] | Minimum [%] |
|---|---|---|---|
| 19.11.2021 | 36.5 | 47.2 | 30.4 |
| 18.11.2021 | 90.9 | 100.0 | 31.7 |
| 17.11.2021 | 99.9 | 100.0 | 99.7 |
| 16.11.2021 | 58.6 | 97.4 | 19.8 |
| 04.06.2019 | 49.0 | 59.4 | 41.7 |
| 03.06.2019 | 36.6 | 49.3 | 24.5 |
| 02.06.2019 | 48.0 | 62.5 | 29.8 |
© Bayerisches Landesamt für Umwelt 2026