
- Start >
- Meteorology >
- Air moisture >
- Bayern >
- Hartenhof >
- Chart of total period

Chart of total period Hartenhof
Air moisture from 18.08.1994 to 26.10.2021
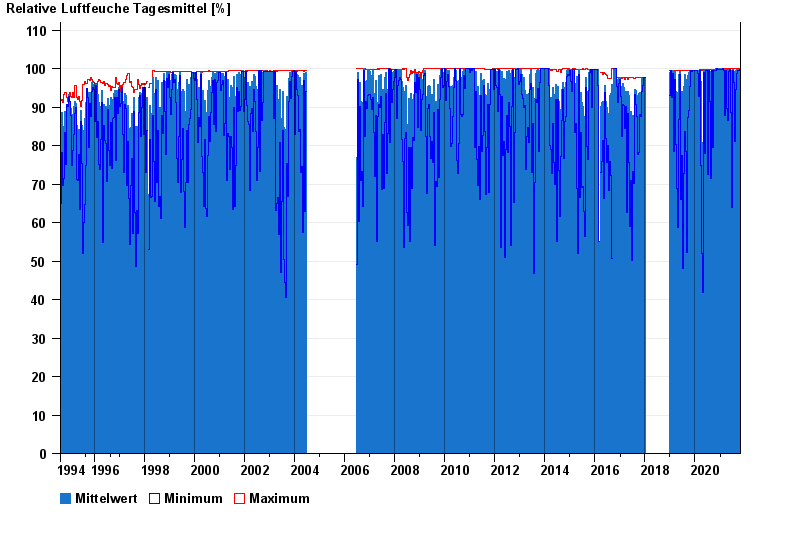
Note: The time series in the selected period has gaps.
| Date | Mean value [%] | Maximum [%] | Minimum [%] |
|---|---|---|---|
| 26.10.2021 | 99.9 | 100.0 | 99.3 |
| 25.10.2021 | 96.0 | 100.0 | 69.9 |
| 24.10.2021 | 86.6 | 100.0 | 47.2 |
| 23.10.2021 | 94.0 | 100.0 | 67.4 |
| 22.10.2021 | 85.2 | 99.8 | 42.7 |
| 21.10.2021 | 79.2 | 100.0 | 55.9 |
| 20.10.2021 | 88.7 | 99.9 | 48.7 |
© Bayerisches Landesamt für Umwelt 2024