
- Start >
- Meteorology >
- Air moisture >
- Bayern >
- Fladungen-Leubach >
- Chart of total period

Chart of total period Fladungen-Leubach
Air moisture from 21.11.2008 to 29.04.2024
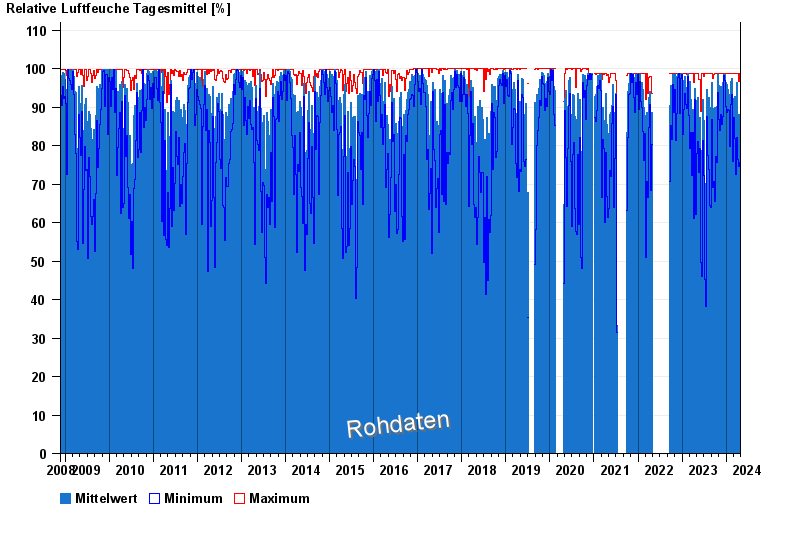
Note: The time series in the selected period has gaps.
| Date | Mean value [%] | Maximum [%] | Minimum [%] |
|---|---|---|---|
| 29.04.2024 | 64.6 | 87.1 | 43.4 |
| 28.04.2024 | 62.1 | 83.0 | 43.6 |
| 27.04.2024 | 69.9 | 96.5 | 37.0 |
| 26.04.2024 | 75.4 | 93.6 | 50.3 |
| 25.04.2024 | 81.7 | 93.3 | 60.1 |
| 24.04.2024 | 81.9 | 94.5 | 56.5 |
| 23.04.2024 | 64.7 | 88.0 | 39.2 |
© Bayerisches Landesamt für Umwelt 2024