
- Start >
- Lakes >
- Waterlevel >
- Inn >
- St. Quirin >
- Chart of year

Chart of year St. Quirin / Tegernsee
Waterlevel from 27.04.2024 to 26.04.2025
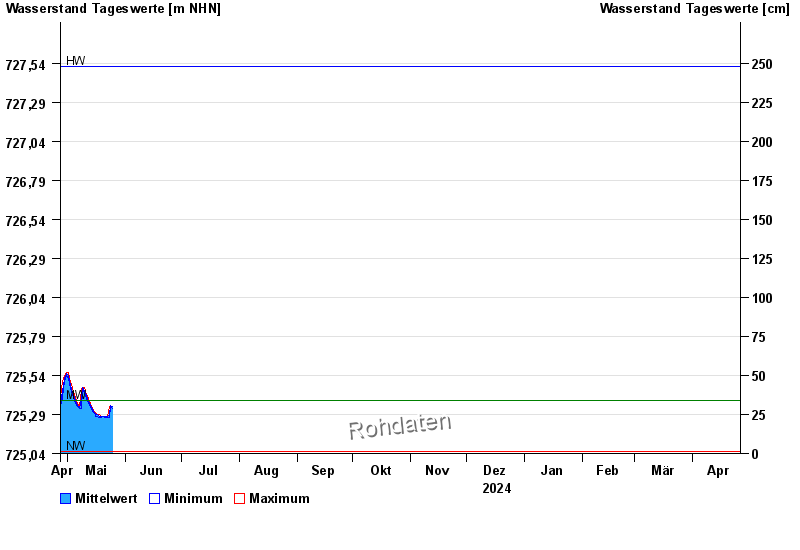
Linien: keine | Hauptwerte | Meldestufen | mittlerer Seespiegel | Hochwassermarken | historische Ereignisse
| Date | Mean value [m above sealevel] | Maximum [m above sealevel] | Minimum [m above sealevel] |
|---|---|---|---|
| 10.06.2024 | 725.64 | 725.65 | 725.64 |
| 09.06.2024 | 725.66 | 725.69 | 725.65 |
| 08.06.2024 | 725.73 | 725.79 | 725.69 |
| 07.06.2024 | 725.86 | 725.94 | 725.79 |
| 06.06.2024 | 726.02 | 726.11 | 725.94 |
| 05.06.2024 | 726.23 | 726.34 | 726.12 |
| 04.06.2024 | 726.43 | 726.47 | 726.35 |
© Bayerisches Landesamt für Umwelt 2024