
- Start >
- Lakes >
- Waterlevel >
- Iller - Lech - Bodensee >
- Mühlberg >
- Chart of year

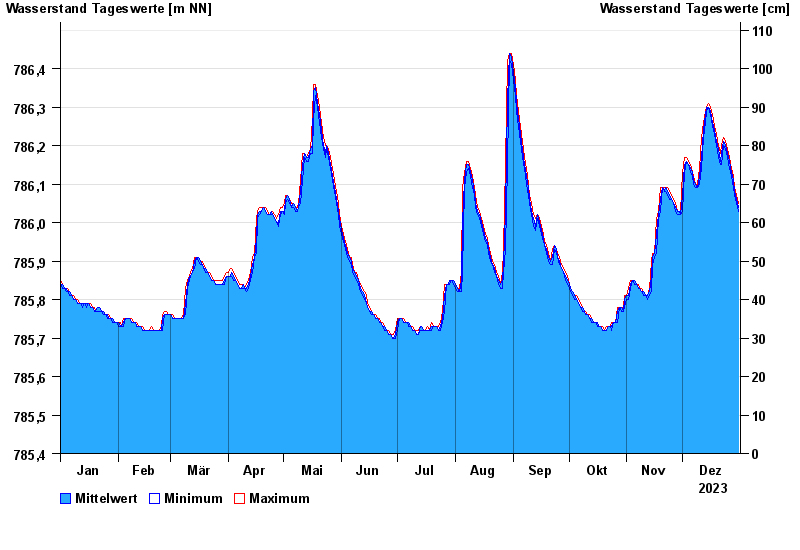
Chart of year Mühlberg / Bannwaldsee
Waterlevel from 01.01.2023 to 31.12.2023
Linien: keine | Hauptwerte | Meldestufen | mittlerer Seespiegel | Hochwassermarken | historische Ereignisse
| Date | Mean value [m above sealevel] | Maximum [m above sealevel] | Minimum [m above sealevel] |
|---|---|---|---|
| 31.12.2023 | 786.04 | 786.05 | 786.03 |
| 30.12.2023 | 786.06 | 786.07 | 786.05 |
| 29.12.2023 | 786.08 | 786.09 | 786.07 |
| 28.12.2023 | 786.11 | 786.12 | 786.09 |
| 27.12.2023 | 786.13 | 786.14 | 786.12 |
| 26.12.2023 | 786.16 | 786.17 | 786.14 |
| 25.12.2023 | 786.18 | 786.19 | 786.17 |
© Bayerisches Landesamt für Umwelt 2024