
- Start >
- Lakes >
- Waterlevel >
- Bayern >
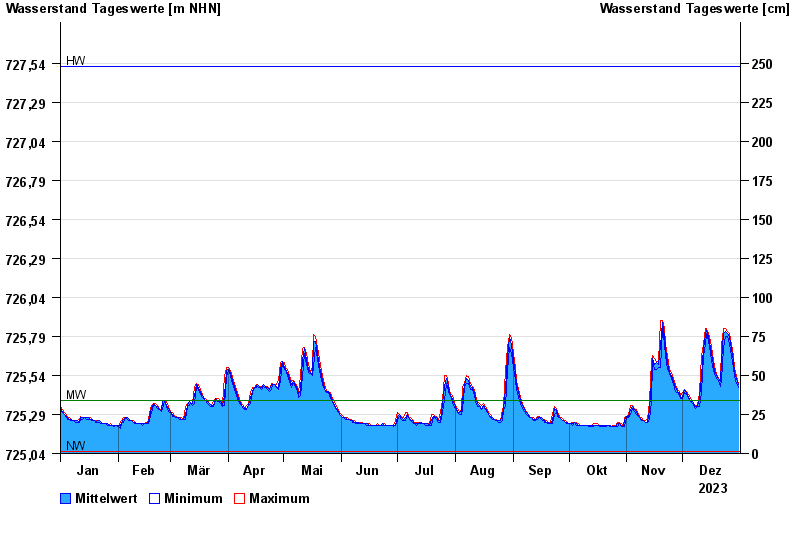
- St. Quirin >
- Chart of year

Chart of year St. Quirin / Tegernsee
Waterlevel from 01.01.2023 to 31.12.2023
Linien: keine | Hauptwerte | Meldestufen | mittlerer Seespiegel | Hochwassermarken | historische Ereignisse
| Date | Mean value [m above sealevel] | Maximum [m above sealevel] | Minimum [m above sealevel] |
|---|---|---|---|
| 31.12.2023 | 725.48 | 725.49 | 725.46 |
| 30.12.2023 | 725.52 | 725.53 | 725.49 |
| 29.12.2023 | 725.56 | 725.59 | 725.53 |
| 28.12.2023 | 725.63 | 725.66 | 725.59 |
| 27.12.2023 | 725.71 | 725.74 | 725.66 |
| 26.12.2023 | 725.78 | 725.81 | 725.74 |
| 25.12.2023 | 725.81 | 725.82 | 725.79 |
© Bayerisches Landesamt für Umwelt 2024