
Chart of total period WACKERSDORF 2T
Groundwater level [m above sealevel]: 394,73
Distance to surface [m]: 5,45
Last value from 24.07.2026 04:00
Ground level [m above sealevel]: 400.18
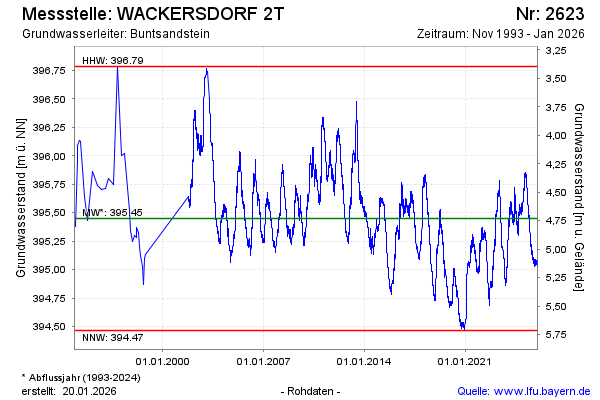
| Date | Groundwater level [m above sealevel] |
|---|---|
| 23.07.2026 | 394.74 |
| 22.07.2026 | 394.74 |
| 21.07.2026 | 394.74 |
| 20.07.2026 | 394.75 |
| 19.07.2026 | 394.76 |
| 18.07.2026 | 394.78 |
| 17.07.2026 | 394.78 |
| 16.07.2026 | 394.78 |