
Chart of total period TABECKENDORF K 8A
note
GW Messstelle im Verdichtungsnetz
Groundwater level [m above sealevel]: 343.91
Distance to surface [m]: 3.88
Last value from 24.06.2026 08:00
Ground level [m above sealevel]: 347.79
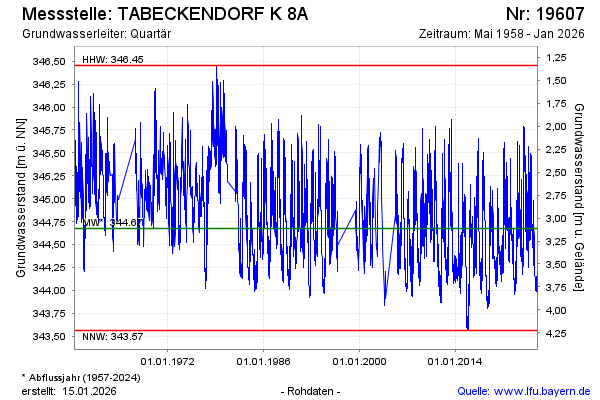
| Date | Groundwater level [m above sealevel] |
|---|---|
| 29.06.2026 | 343.82 |
| 28.06.2026 | 343.83 |
| 27.06.2026 | 343.84 |
| 26.06.2026 | 343.86 |
| 25.06.2026 | 343.88 |
| 24.06.2026 | 343.90 |
| 23.06.2026 | 343.91 |
| 22.06.2026 | 343.93 |