
- Start >
- Groundwater >
- Waterlevel of upper layer >
- Untere Donau >
- BEHRHOF - A 13 >
- Chart of total period

Chart of total period BEHRHOF - A 13
Groundwater levels of the total period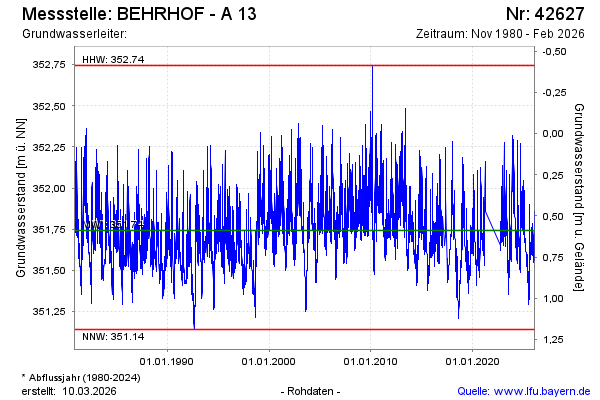
Groundwater level [m above sealevel]: 351.47
Distance to surface [m]: 0.86
Last value from 13.05.2026 11:50
Ground level [m above sealevel]: 352.33
| Date | Groundwater level [m above sealevel] |
|---|---|
| 13.05.2026 | 351.48 |
| 12.05.2026 | 351.48 |
| 11.05.2026 | 351.45 |
| 10.05.2026 | 351.45 |
| 09.05.2026 | 351.47 |
| 08.05.2026 | 351.48 |
| 07.05.2026 | 351.49 |
| 06.05.2026 | 351.46 |
© Bayerisches Landesamt für Umwelt 2026