
- Start >
- Groundwater >
- Waterlevel of upper layer >
- Naab - Regen >
- Vorbach >
- Chart of total period

Chart of total period Vorbach
Groundwater levels of the total period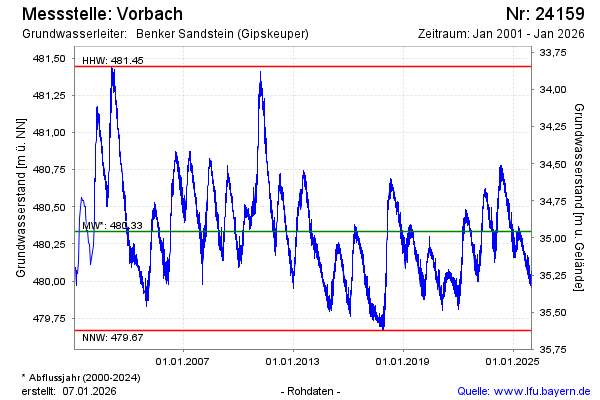
Groundwater level [m above sealevel]: 479.99
Distance to surface [m]: 35.30
Last value from 07.03.2026 15:00
Ground level [m above sealevel]: 515.29
| Date | Groundwater level [m above sealevel] |
|---|---|
| 07.03.2026 | 479.98 |
| 06.03.2026 | 479.98 |
| 05.03.2026 | 479.98 |
| 04.03.2026 | 479.96 |
| 03.03.2026 | 479.95 |
| 02.03.2026 | 479.95 |
| 01.03.2026 | 479.93 |
| 28.02.2026 | 479.95 |
© Bayerisches Landesamt für Umwelt 2026