
- Start >
- Groundwater >
- Waterlevel of upper layer >
- Naab - Regen >
- HAHNBACH Q 5 >
- Chart of total period

Chart of total period HAHNBACH Q 5
Groundwater levels of the total period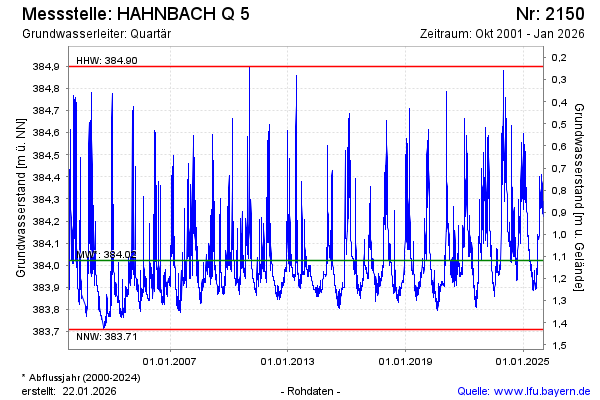
Groundwater level [m above sealevel]: 384.21
Distance to surface [m]: 0.93
Last value from 14.04.2026 04:00
Ground level [m above sealevel]: 385.14
| Date | Groundwater level [m above sealevel] |
|---|---|
| 13.04.2026 | 384.22 |
| 12.04.2026 | 384.22 |
| 11.04.2026 | 384.22 |
| 10.04.2026 | 384.22 |
| 09.04.2026 | 384.22 |
| 08.04.2026 | 384.23 |
| 07.04.2026 | 384.23 |
| 06.04.2026 | 384.24 |
© Bayerisches Landesamt für Umwelt 2026