
- Start >
- Groundwater >
- Waterlevel of upper layer >
- Unterer Main >
- Wenschdorf S 8 >
- Chart of total period

Chart of total period Wenschdorf S 8
Groundwater levels of the total period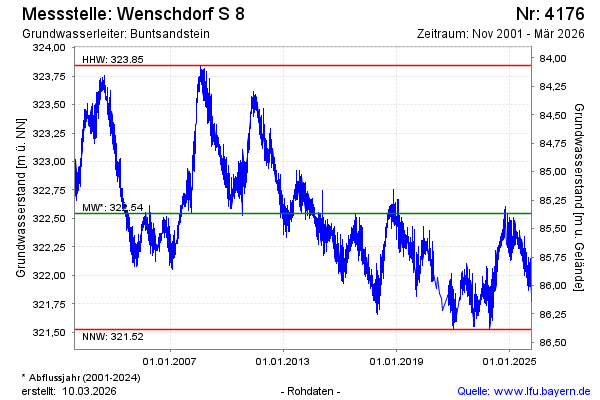
Groundwater level [m above sealevel]: 321.86
Distance to surface [m]: 86.05
Last value from 20.05.2026 10:00
Ground level [m above sealevel]: 407.91
| Date | Groundwater level [m above sealevel] |
|---|---|
| 20.05.2026 | 321.88 |
| 19.05.2026 | 321.90 |
| 18.05.2026 | 321.93 |
| 17.05.2026 | 321.93 |
| 16.05.2026 | 321.98 |
| 15.05.2026 | 322.05 |
| 14.05.2026 | 322.06 |
| 13.05.2026 | 322.01 |
© Bayerisches Landesamt für Umwelt 2026