
- Start >
- Groundwater >
- Waterlevel of upper layer >
- Unterer Main >
- Faulbach Q 1 >
- Chart of total period

Chart of total period Faulbach Q 1
Groundwater levels of the total period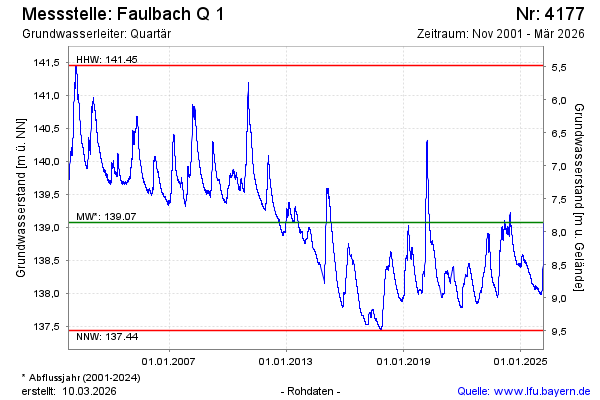
note
Messgerät seit 12.02.2024 in Reparatur. Monatliche Auslesung der Daten.
Groundwater level [m above sealevel]: 138.99
Distance to surface [m]: 7.75
Last value from 19.03.2024 12:00
Ground level [m above sealevel]: 146.74
| Date | Groundwater level [m above sealevel] |
|---|---|
| 19.03.2024 | 139.00 |
| 18.03.2024 | 139.01 |
| 17.03.2024 | 139.01 |
| 16.03.2024 | 139.02 |
| 15.03.2024 | 139.04 |
| 14.03.2024 | 139.04 |
| 13.03.2024 | 139.04 |
| 12.03.2024 | 139.04 |
© Bayerisches Landesamt für Umwelt 2024