
- Start >
- Groundwater >
- Waterlevel of upper layer >
- Obere Donau >
- Hochmutting Süd >
- Chart of total period

Chart of total period Hochmutting Süd
Groundwater levels of the total period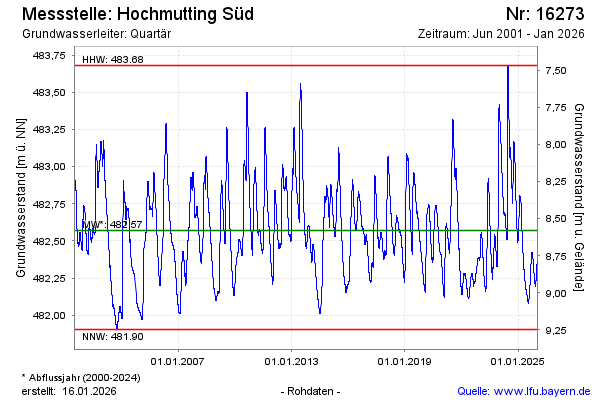
Groundwater level [m above sealevel]: 482.29
Distance to surface [m]: 8.86
Last value from 20.05.2026 10:00
Ground level [m above sealevel]: 491.15
| Date | Groundwater level [m above sealevel] |
|---|---|
| 20.05.2026 | 482.29 |
| 19.05.2026 | 482.30 |
| 18.05.2026 | 482.31 |
| 17.05.2026 | 482.31 |
| 16.05.2026 | 482.32 |
| 15.05.2026 | 482.32 |
| 14.05.2026 | 482.33 |
| 13.05.2026 | 482.34 |
© Bayerisches Landesamt für Umwelt 2026