
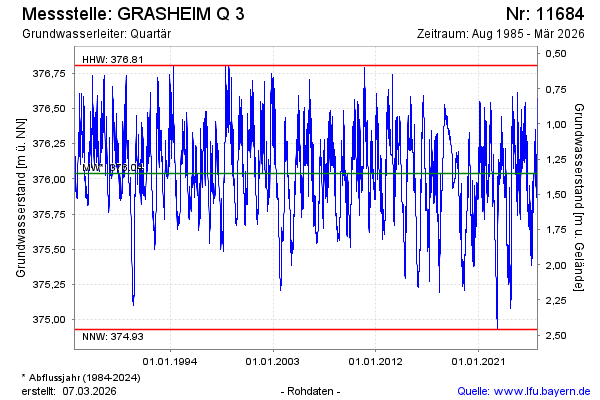
Chart of total period GRASHEIM Q 3
Groundwater level [m above sealevel]: 375,11
Distance to surface [m]: 2,28
Last value from 23.07.2026 09:00
Ground level [m above sealevel]: 377.39
| Date | Groundwater level [m above sealevel] |
|---|---|
| 23.07.2026 | 375.11 |
| 22.07.2026 | 375.12 |
| 21.07.2026 | 375.13 |
| 20.07.2026 | 375.15 |
| 19.07.2026 | 375.14 |
| 18.07.2026 | 375.12 |
| 17.07.2026 | 375.13 |
| 16.07.2026 | 375.12 |