
- Start >
- Groundwater >
- Waterlevel of upper layer >
- Isar >
- GABLINGEN 10 >
- Chart of total period

Chart of total period GABLINGEN 10
Groundwater levels of the total period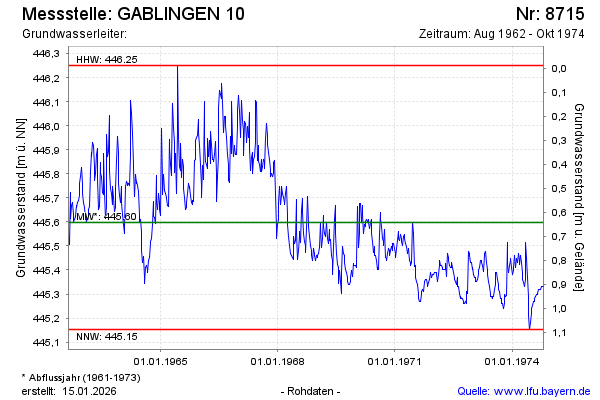
Groundwater level [m above sealevel]: 445.41
Distance to surface [m]: 0.83
Last value from 25.10.1974 12:00
Ground level [m above sealevel]: 446.24
| Date | Groundwater level [m above sealevel] |
|---|---|
| 18.10.1974 | 445.33 |
| 11.10.1974 | 445.33 |
| 04.10.1974 | 445.33 |
| 27.09.1974 | 445.32 |
| 20.09.1974 | 445.32 |
| 13.09.1974 | 445.32 |
| 06.09.1974 | 445.32 |
| 30.08.1974 | 445.30 |
© Bayerisches Landesamt für Umwelt 2026