
- Start >
- Groundwater >
- Waterlevel of upper layer >
- Inn >
- Fridolfing GWM1 >
- Chart of total period

Chart of total period Fridolfing GWM1
Groundwater levels of the total period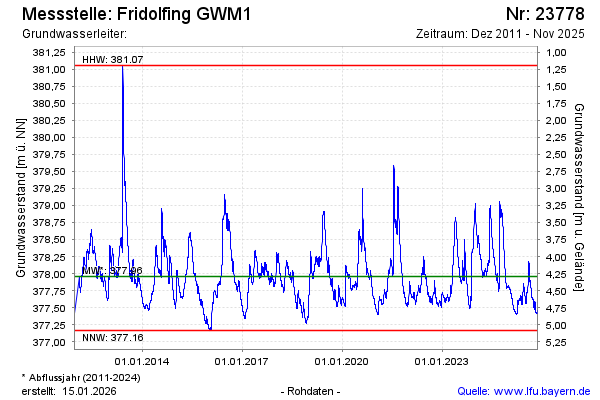
Groundwater level [m above sealevel]: 377.69
Distance to surface [m]: 4.56
Last value from 05.03.2026 11:00
Ground level [m above sealevel]: 382.25
| Date | Groundwater level [m above sealevel] |
|---|---|
| 05.03.2026 | 377.69 |
| 04.03.2026 | 377.68 |
| 03.03.2026 | 377.67 |
| 02.03.2026 | 377.65 |
| 01.03.2026 | 377.63 |
| 28.02.2026 | 377.59 |
| 27.02.2026 | 377.53 |
| 26.02.2026 | 377.46 |
© Bayerisches Landesamt für Umwelt 2026