
- Start >
- Groundwater >
- Waterlevel of upper layer >
- Iller - Lech - Bodensee >
- THANNHAUSEN Q/B >
- Chart of total period

Chart of total period THANNHAUSEN Q/B
Groundwater levels of the total period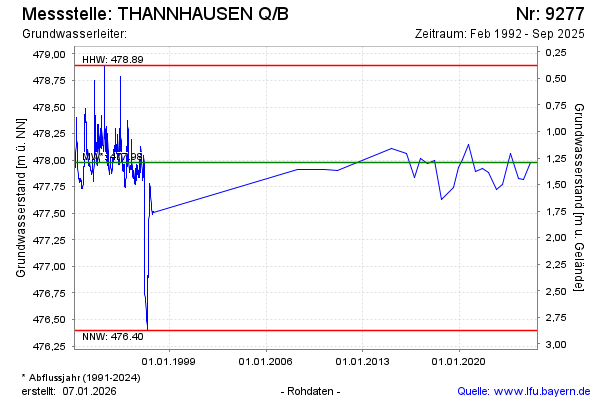
Groundwater level [m above sealevel]: 478.19
Distance to surface [m]: 1.08
Last value from 03.02.2026 13:50
Ground level [m above sealevel]: 479.27
| Date | Groundwater level [m above sealevel] |
|---|---|
| 08.09.2025 | 477.75 |
| 20.02.2025 | 477.98 |
| 29.08.2024 | 477.82 |
| 11.04.2024 | 477.83 |
| 05.09.2023 | 478.06 |
| 23.02.2023 | 477.77 |
| 02.09.2022 | 477.72 |
| 17.02.2022 | 477.88 |
© Bayerisches Landesamt für Umwelt 2026