
- Start >
- Groundwater >
- Waterlevel of upper layer >
- Iller - Lech - Bodensee >
- OTTOBEUREN D 67 >
- Chart of total period

Chart of total period OTTOBEUREN D 67
Groundwater levels of the total period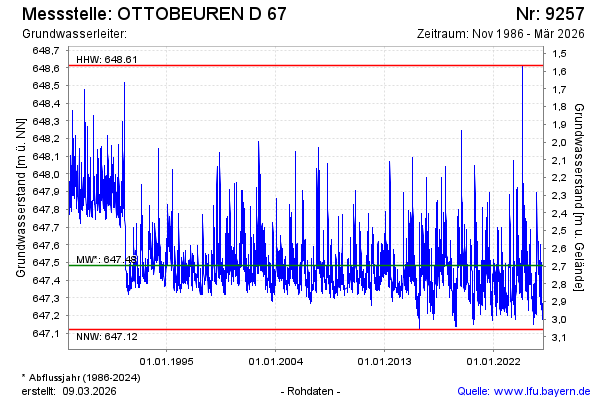
Groundwater level [m above sealevel]: 647.23
Distance to surface [m]: 2.95
Last value from 05.05.2026 07:50
Ground level [m above sealevel]: 650.18
| Date | Groundwater level [m above sealevel] |
|---|---|
| 05.05.2026 | 647.23 |
| 04.05.2026 | 647.23 |
| 03.05.2026 | 647.24 |
| 02.05.2026 | 647.24 |
| 01.05.2026 | 647.25 |
| 30.04.2026 | 647.25 |
| 29.04.2026 | 647.26 |
| 28.04.2026 | 647.27 |
© Bayerisches Landesamt für Umwelt 2026