
- Start >
- Groundwater >
- Waterlevel of upper layer >
- Iller - Lech - Bodensee >
- IGLING 957 >
- Chart of total period

Chart of total period IGLING 957
Groundwater levels of the total period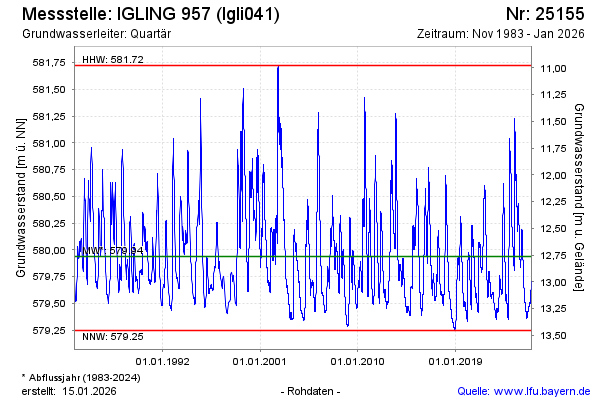
Groundwater level [m above sealevel]: 579.69
Distance to surface [m]: 13.01
Last value from 09.05.2026 04:00
Ground level [m above sealevel]: 592.70
| Date | Groundwater level [m above sealevel] |
|---|---|
| 08.05.2026 | 579.70 |
| 07.05.2026 | 579.71 |
| 06.05.2026 | 579.72 |
| 05.05.2026 | 579.74 |
| 04.05.2026 | 579.75 |
| 03.05.2026 | 579.76 |
| 02.05.2026 | 579.78 |
| 01.05.2026 | 579.79 |
© Bayerisches Landesamt für Umwelt 2026