
- Start >
- Groundwater >
- Waterlevel of upper layer >
- Iller - Lech - Bodensee >
- EGG D 4 >
- Chart of total period

Chart of total period EGG D 4
Groundwater levels of the total period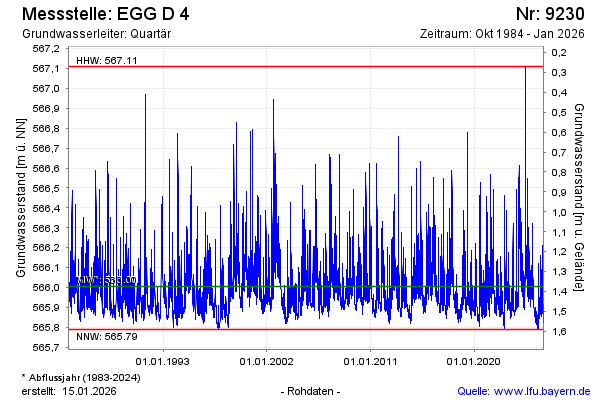
Groundwater level [m above sealevel]: 565.86
Distance to surface [m]: 1.52
Last value from 22.05.2026 10:00
Ground level [m above sealevel]: 567.38
| Date | Groundwater level [m above sealevel] |
|---|---|
| 22.05.2026 | 565.86 |
| 21.05.2026 | 565.86 |
| 20.05.2026 | 565.85 |
| 19.05.2026 | 565.85 |
| 18.05.2026 | 565.85 |
| 17.05.2026 | 565.86 |
| 16.05.2026 | 565.86 |
| 15.05.2026 | 565.86 |
© Bayerisches Landesamt für Umwelt 2026