
- Start >
- Groundwater >
- Waterlevel of upper layer >
- Bayern >
- VOB GWM 3i >
- Chart of total period

Chart of total period VOB GWM 3i
Groundwater levels of the total period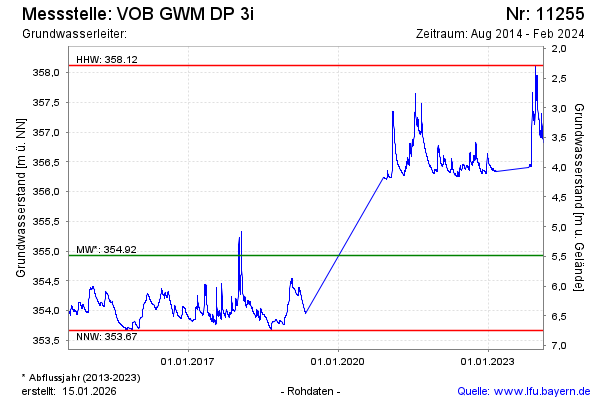
Groundwater level [m above sealevel]: 356.82
Distance to surface [m]: 3.59
Last value from 13.02.2024 14:00
Ground level [m above sealevel]: 360.41
| Date | Groundwater level [m above sealevel] |
|---|---|
| 13.02.2024 | 356.82 |
| 12.02.2024 | 356.83 |
| 11.02.2024 | 356.83 |
| 10.02.2024 | 356.84 |
| 09.02.2024 | 356.84 |
| 08.02.2024 | 356.85 |
| 07.02.2024 | 356.87 |
| 06.02.2024 | 356.90 |
© Bayerisches Landesamt für Umwelt 2025