
- Start >
- Groundwater >
- Waterlevel of upper layer >
- Bayern >
- THANNHAUSEN Q/C >
- Chart of total period

Chart of total period THANNHAUSEN Q/C
Groundwater levels of the total period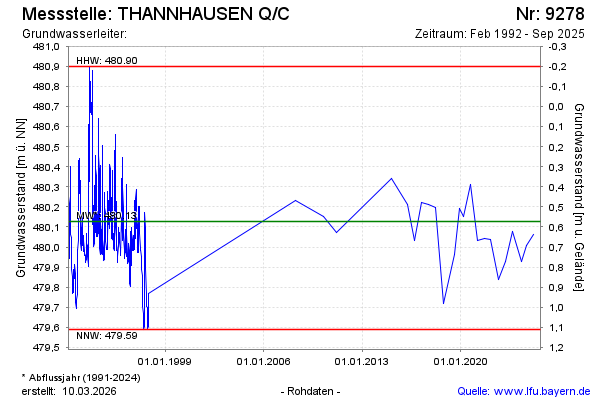
Groundwater level [m above sealevel]: 479.99
Distance to surface [m]: 0.71
Last value from 08.09.2025 10:15
Ground level [m above sealevel]: 480.70
| Date | Groundwater level [m above sealevel] |
|---|---|
| 29.08.2024 | 480.01 |
| 11.04.2024 | 479.93 |
| 05.09.2023 | 480.08 |
| 23.02.2023 | 479.93 |
| 02.09.2022 | 479.84 |
| 17.02.2022 | 480.04 |
| 07.09.2021 | 480.04 |
| 02.03.2021 | 480.03 |
© Bayerisches Landesamt für Umwelt 2026