
- Start >
- Groundwater >
- Waterlevel of upper layer >
- Bayern >
- THALHAM/OBING 622 >
- Chart of total period

Chart of total period THALHAM/OBING 622
Groundwater levels of the total period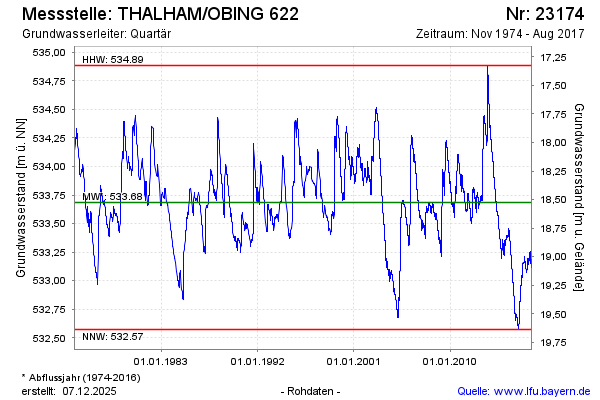
Groundwater level [m above sealevel]: 533.19
Distance to surface [m]: 19.02
Last value from 09.08.2017 12:40
Ground level [m above sealevel]: 552.21
| Date | Groundwater level [m above sealevel] |
|---|---|
| 09.08.2017 | 533.18 |
| 08.08.2017 | 533.18 |
| 07.08.2017 | 533.18 |
| 06.08.2017 | 533.18 |
| 05.08.2017 | 533.18 |
| 04.08.2017 | 533.19 |
| 03.08.2017 | 533.19 |
| 02.08.2017 | 533.19 |
© Bayerisches Landesamt für Umwelt 2026