
- Start >
- Groundwater >
- Waterlevel of upper layer >
- Bayern >
- STADT BOBINGEN 2 >
- Chart of total period

Chart of total period STADT BOBINGEN 2
Groundwater levels of the total period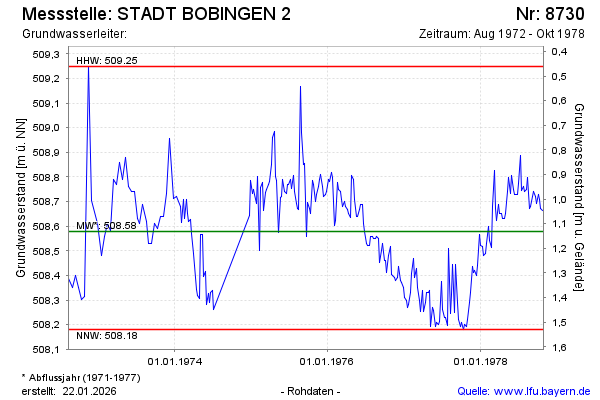
Groundwater level [m above sealevel]: 508.77
Distance to surface [m]: 0.94
Last value from 30.10.1978 12:00
Ground level [m above sealevel]: 509.71
| Date | Groundwater level [m above sealevel] |
|---|---|
| 23.10.1978 | 508.66 |
| 16.10.1978 | 508.67 |
| 09.10.1978 | 508.71 |
| 02.10.1978 | 508.73 |
| 25.09.1978 | 508.69 |
| 18.09.1978 | 508.72 |
| 11.09.1978 | 508.74 |
| 04.09.1978 | 508.72 |
© Bayerisches Landesamt für Umwelt 2026