
- Start >
- Groundwater >
- Waterlevel of upper layer >
- Bayern >
- SCHWABMUENCHEN 603 >
- Chart of total period

Chart of total period SCHWABMUENCHEN 603
Groundwater levels of the total period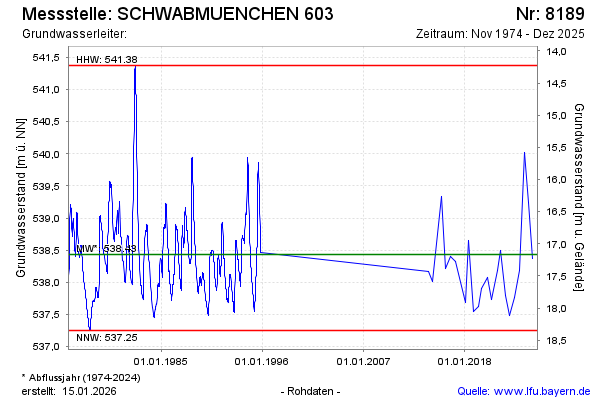
Groundwater level [m above sealevel]: 537.42
Distance to surface [m]: 18.18
Last value from 15.12.2025 10:00
Ground level [m above sealevel]: 555.60
| Date | Groundwater level [m above sealevel] |
|---|---|
| 04.12.2024 | 539.24 |
| 01.07.2024 | 540.02 |
| 14.12.2023 | 538.19 |
| 15.06.2023 | 537.76 |
| 01.12.2022 | 537.49 |
| 15.06.2022 | 537.79 |
| 09.12.2021 | 538.50 |
| 19.07.2021 | 538.18 |
© Bayerisches Landesamt für Umwelt 2026