
- Start >
- Groundwater >
- Waterlevel of upper layer >
- Bayern >
- SCHORN 1.1A >
- Chart of total period

Chart of total period SCHORN 1.1A
Groundwater levels of the total period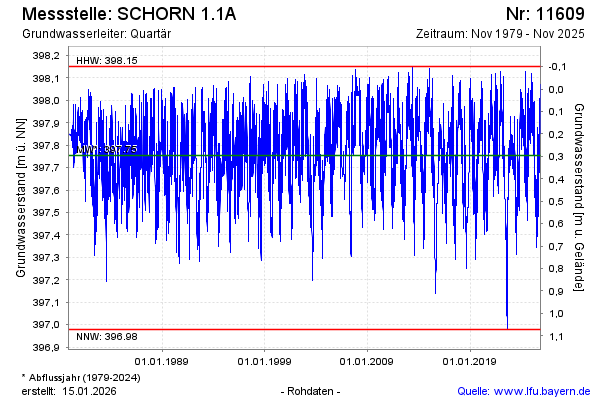
Groundwater level [m above sealevel]: 397.69
Distance to surface [m]: 0.36
Last value from 09.04.2026 14:00
Ground level [m above sealevel]: 398.05
| Date | Groundwater level [m above sealevel] |
|---|---|
| 09.04.2026 | 397.69 |
| 08.04.2026 | 397.71 |
| 07.04.2026 | 397.73 |
| 06.04.2026 | 397.75 |
| 05.04.2026 | 397.78 |
| 04.04.2026 | 397.80 |
| 03.04.2026 | 397.82 |
| 02.04.2026 | 397.85 |
© Bayerisches Landesamt für Umwelt 2026