
- Start >
- Groundwater >
- Waterlevel of upper layer >
- Bayern >
- Rohrbrunn S 1 >
- Chart of total period

Chart of total period Rohrbrunn S 1
Groundwater levels of the total period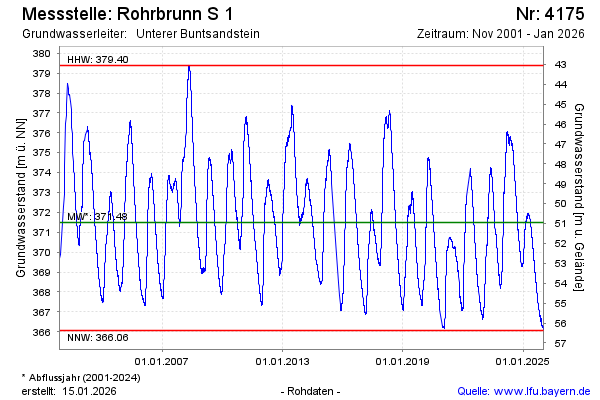
note
Datenfernübertragung ist seit 19.01.2026 ausgefallen. Monatliche Auslesung der Daten.
Groundwater level [m above sealevel]: 370.55
Distance to surface [m]: 51.89
Last value from 08.03.2026 10:00
Ground level [m above sealevel]: 422.44
| Date | Groundwater level [m above sealevel] |
|---|---|
| 08.03.2026 | 370.52 |
| 07.03.2026 | 370.43 |
| 06.03.2026 | 370.31 |
| 19.01.2026 | 366.15 |
| 18.01.2026 | 366.12 |
| 17.01.2026 | 366.09 |
| 16.01.2026 | 366.10 |
| 15.01.2026 | 366.11 |
© Bayerisches Landesamt für Umwelt 2026