
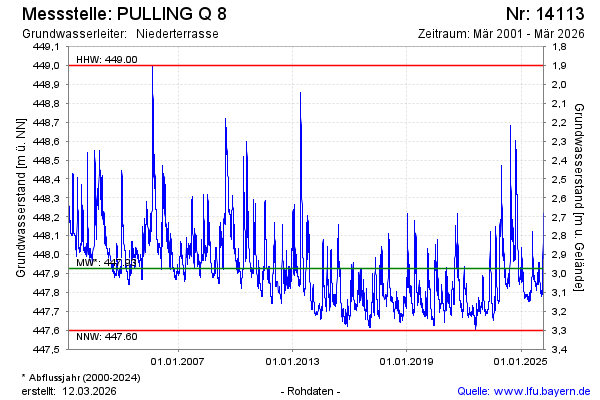
Chart of total period PULLING Q 8
Groundwater level [m above sealevel]: 447.77
Distance to surface [m]: 3.13
Last value from 03.07.2026 09:00
Ground level [m above sealevel]: 450.90
| Date | Groundwater level [m above sealevel] |
|---|---|
| 03.07.2026 | 447.77 |
| 02.07.2026 | 447.77 |
| 01.07.2026 | 447.74 |
| 30.06.2026 | 447.71 |
| 29.06.2026 | 447.71 |
| 28.06.2026 | 447.71 |
| 27.06.2026 | 447.71 |
| 26.06.2026 | 447.71 |