
- Start >
- Groundwater >
- Waterlevel of upper layer >
- Bayern >
- OBERSCHLEISSHEIM >
- Chart of total period

Chart of total period OBERSCHLEISSHEIM
Groundwater levels of the total period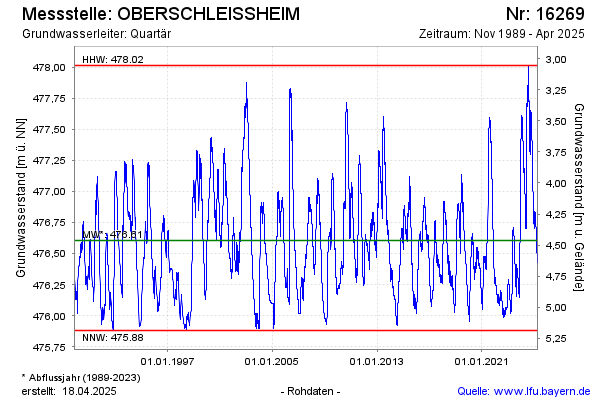
Groundwater level [m above sealevel]: 476.12
Distance to surface [m]: 4.95
Last value from 29.05.2026 10:00
Ground level [m above sealevel]: 481.07
| Date | Groundwater level [m above sealevel] |
|---|---|
| 29.05.2026 | 476.12 |
| 28.05.2026 | 476.12 |
| 27.05.2026 | 476.13 |
| 26.05.2026 | 476.14 |
| 25.05.2026 | 476.15 |
| 24.05.2026 | 476.16 |
| 23.05.2026 | 476.16 |
| 22.05.2026 | 476.17 |
© Bayerisches Landesamt für Umwelt 2026