
- Start >
- Groundwater >
- Waterlevel of upper layer >
- Bayern >
- OBERNDORF MOORHOF 60A >
- Chart of total period

Chart of total period OBERNDORF MOORHOF 60A
Groundwater levels of the total period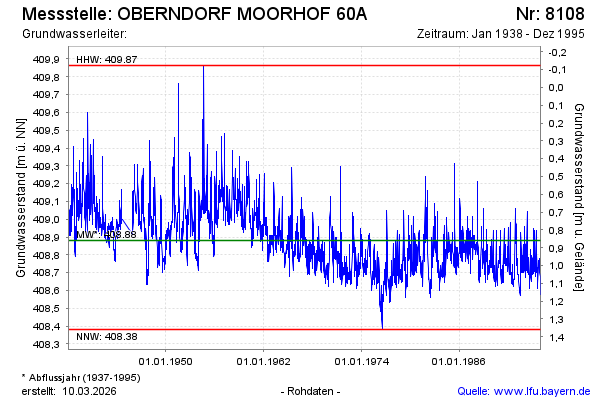
Groundwater level [m above sealevel]: 408.57
Distance to surface [m]: 1.17
Last value from 30.12.1995 12:00
Ground level [m above sealevel]: 409.74
| Date | Groundwater level [m above sealevel] |
|---|---|
| 25.12.1995 | 408.58 |
| 18.12.1995 | 408.60 |
| 11.12.1995 | 408.61 |
| 04.12.1995 | 408.65 |
| 27.11.1995 | 408.66 |
| 20.11.1995 | 408.68 |
| 13.11.1995 | 408.70 |
| 06.11.1995 | 408.73 |
© Bayerisches Landesamt für Umwelt 2026