
- Start >
- Groundwater >
- Waterlevel of upper layer >
- Bayern >
- OBERGRASHEIM 30.01 >
- Chart of total period

Chart of total period OBERGRASHEIM 30.01
Groundwater levels of the total period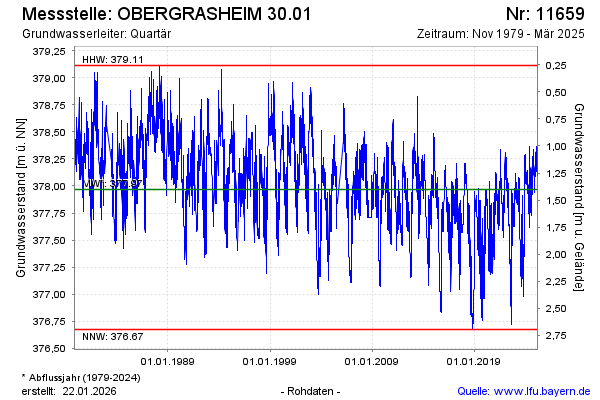
Groundwater level [m above sealevel]: 377.95
Distance to surface [m]: 1.42
Last value from 08.04.2026 14:00
Ground level [m above sealevel]: 379.37
| Date | Groundwater level [m above sealevel] |
|---|---|
| 08.04.2026 | 377.95 |
| 07.04.2026 | 377.96 |
| 06.04.2026 | 377.97 |
| 05.04.2026 | 377.97 |
| 04.04.2026 | 377.98 |
| 03.04.2026 | 378.00 |
| 02.04.2026 | 378.01 |
| 01.04.2026 | 378.01 |
© Bayerisches Landesamt für Umwelt 2026